The biosimilar market is expanding quickly as more innovator biologics lose patent protection. During development of biosimilars, the similarity to the original product needs to be demonstrated at multiple levels. This includes analytical similarity, which means demonstrating that the results obtained from the same analytical method on the two products are sufficiently similar. This demonstration is key as this will reduce the effort on clinical similarity
Inferential statistics
Descriptive statistics is a description of a sample using summary statistics such as mean and standard [1]. Meanwhile, inference provides conclusions on the whole population by using only a sample of the 1.
From a patient perspective, the objective is to demonstrate that the patient receives the same ingredient in the same quantities for any batch of the reference or test product and not only from the batches that were included in the similarity experiment. We therefore need to use inferential statistics, as recommended in the European Medicines Agency (EMA) reflection paper on quantitative comparative evaluation [2].
As multiple source variabilities (between batch and analytical variability) are present in the data, it’s important to have the required level of confidence. For example, you need to be confident about the conclusions drawn from the data when trying to demonstrate that 95 percent of product falls within 99 percent of the reference product.
Data analysis
Typically, the manufacturer of the test product will buy a few batches of the reference product and analyze them together with a random selection of batches of the test product. As we would like to draw conclusions on the whole population from a sample of batches from both test and reference products, we need to use inferential statistics and, therefore, assumptions on the underlying distribution need to be taken.
When data are skewed, normal distribution is usually obtained after log transformation of the data[3]. This transformation also ensures that positive data are correctly modelled. As the manufacturer buys batches of the reference product randomly, a bimodal distribution (or two distinct clusters of data) can be observed. Other distribution may be observed as well, however, for the purposes of this discussion, we will focus on the normal distribution assumption.
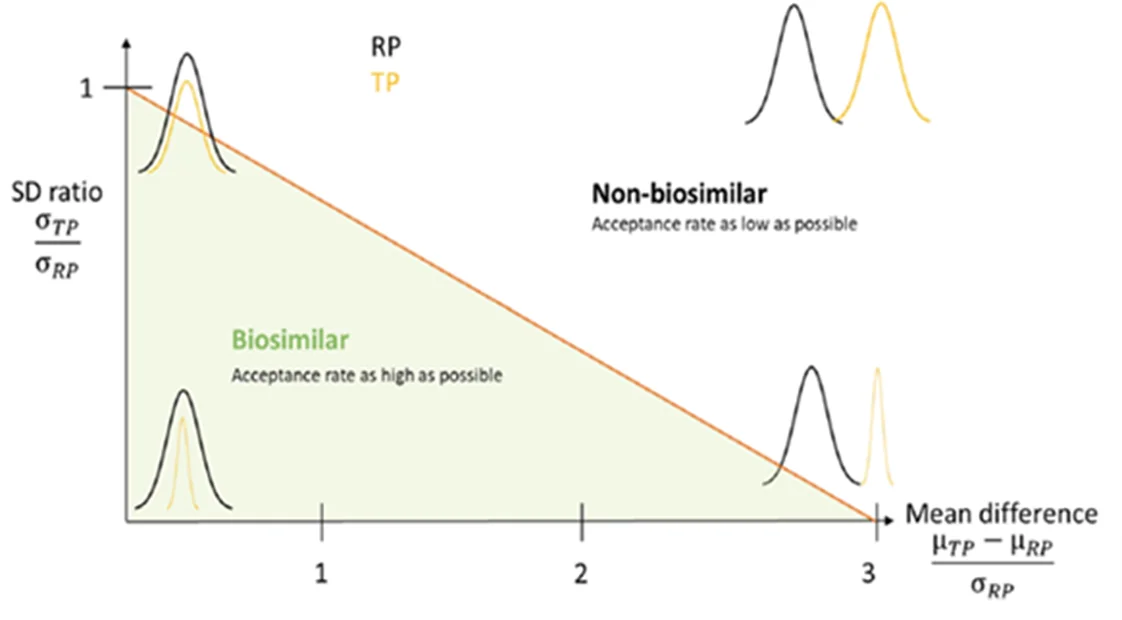
Distributions of the reference and test products may differ by their location (mean), spread (standard deviations) or a combination of both. Based on the idea that a test product with different means can still be considered similar if the standard deviation is , an acceptance region in the form of a triangle on a plot where the x-axis is the difference in means standardized by the standard deviation and the y-axis is the standard deviation ratio2 (Figure 1). This similarity region ensures that a specific fraction of the test product is within a specific range of reference product (both 99% in figure below).
Figure 1: Similarity region (source: Zahel [2])
Nevertheless, when used with the point estimates of the of the test and reference product, this approach remains descriptive. In order to make inference, Thomas Zahel designed and investigated a bootstrapping technique to assess analytical similarity and determine the confidence intervals on both axes[4].
The Bayesian touch
While bootstrapping is an effective technique to obtain confidence intervals, our experience shows that using Bayesian statistical methods is the most straightforward and reliable approach for considering uncertainty. In addition, it is possible to derive the probability of success for any metric to meet any specification or acceptance criteria. Bayesian techniques are also well received by regulatory , and, in particular, the US Food and Drug Administration is increasingly leveraging this methodology for evaluations[5].
We therefore proposed a solution to this problem under a Bayesian framework. The predictive distributions of the absolute mean difference and of the standard deviation ratio contains all the uncertainty related to the actual sample.
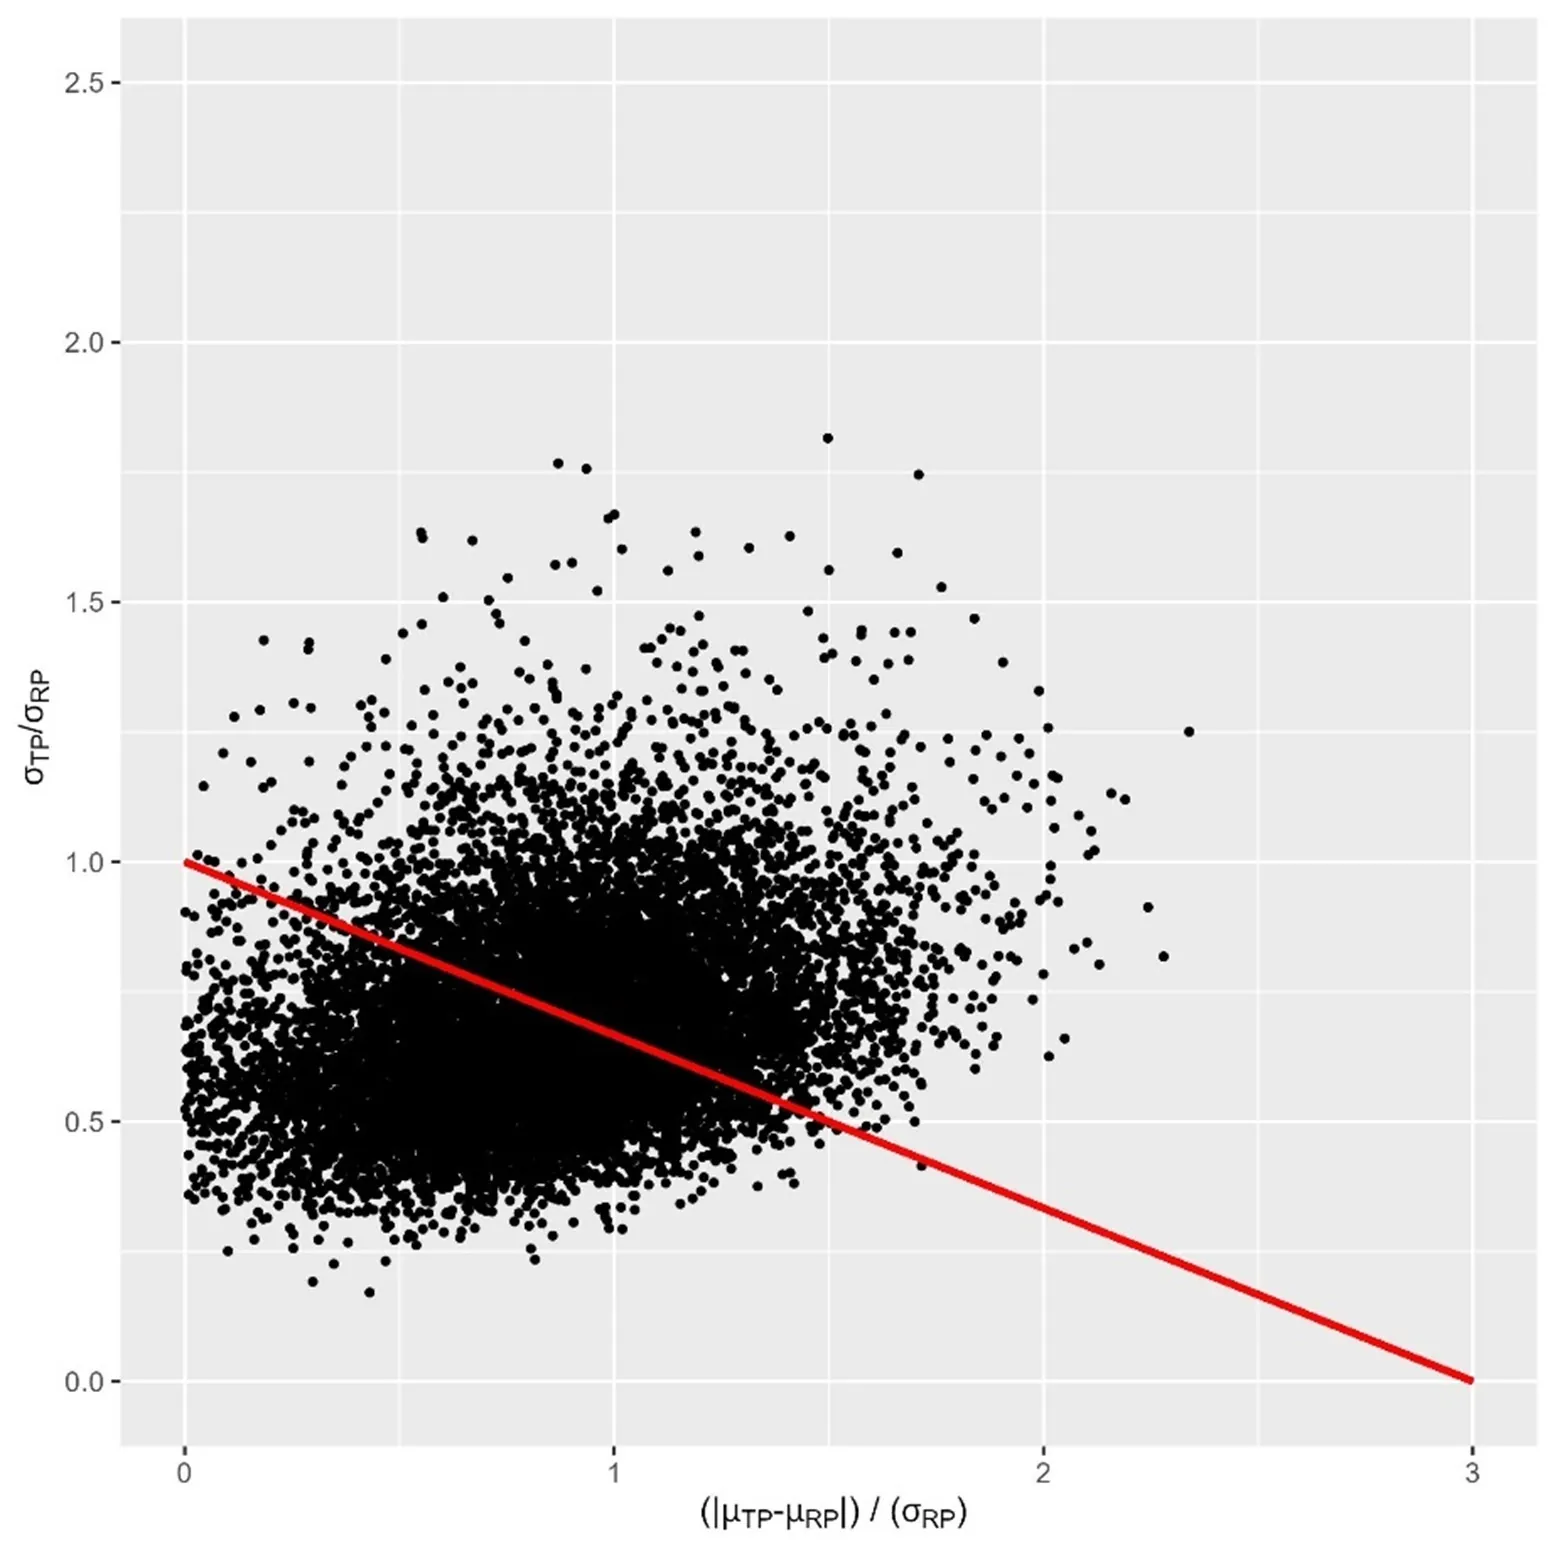
As shown in the figure below, results can be represented as a cloud of data, where each point represents a joint sample drawn from the two predictive distributions. The proportion of points within the similarity region represents the probability to pass the criteria, given the data obtained during the similarity experiment. In this example, probability is low, leading to a failure to demonstrate similarity between the test and reference products.
Figure 2: Representation of the predictive distribution within the similarity region. Axes are the same as figure 1.
Evaluation of the sample size
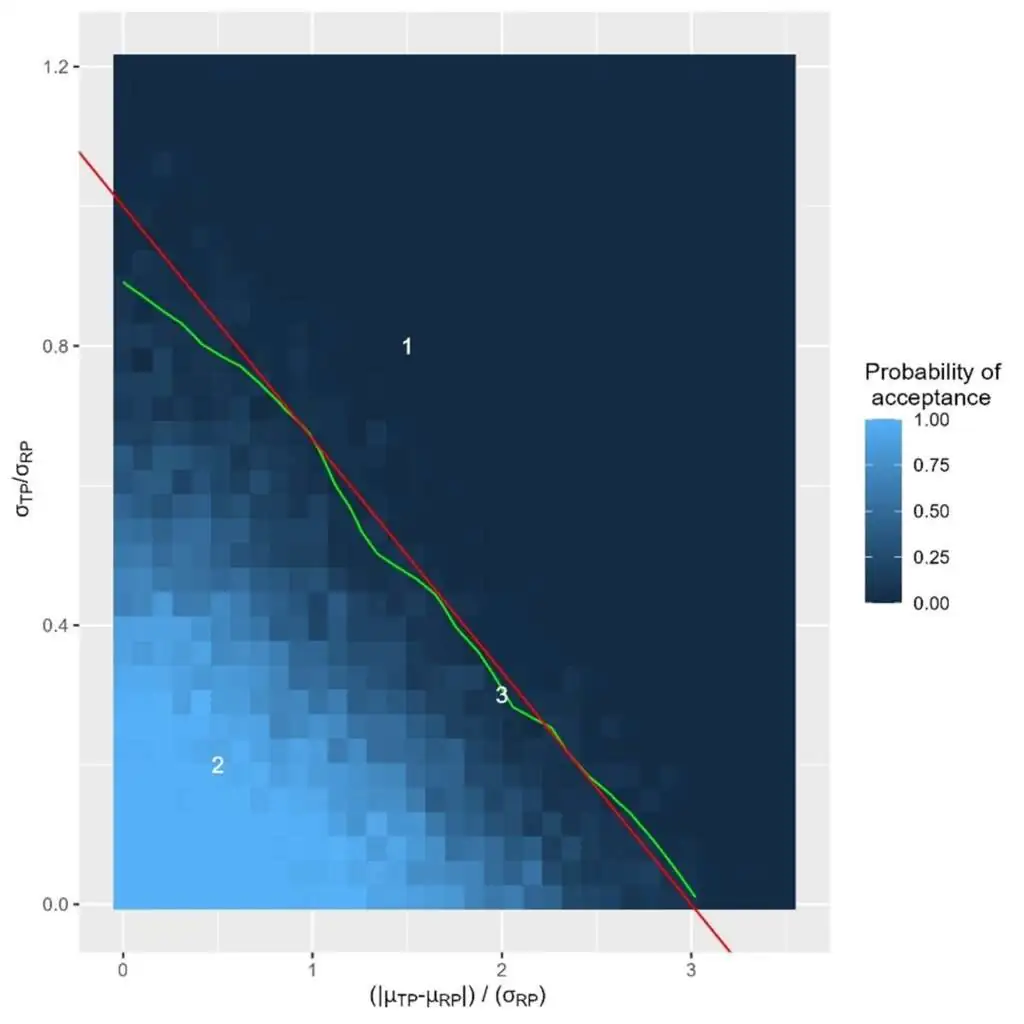
Knowing the number of batches of both reference and test products, the probability of acceptance of the proposed test can be calculated. It can be derived for any differences in means and any standard deviation ratio (Figure 3). From the acceptance sampling theory, we usually discriminate between the producer and patient risks. When translated to this context, the following definition can be made: Both risks can be derived from the plot. The ideal situation would be to move quickly from a high to low probability of acceptance in the vicinity of the (red line).
When located outside the similarity region (Number 1 in Figure 3), probability of acceptance is low, i.e. the patient risk is low (similarity needs to be rejected because test product is too much different from the reference product). When located close to the axis origins (number 2 in Figure 3), probability of acceptance is high, i.e. the producer risk is low (similarity is stated, because test product is very similar to the reference product). When located in the similarity region but close to its border (number 3 in Figure 3), probability of acceptance is low, i.e. producer risk is high (similarity is rejected, although test product is sufficiently similar to the reference product). Producer risk in this region can be mitigated by increasing the sample size.
Figure 3: Operating characteristics of the statistical approach. Axes are the same as figure 1. The result shown is dependent of the sample size. Green line represents the 5% acceptance line. Red line is the boundary of the similarity region.
Conclusions
Demonstrating analytical similarity between two products in the context of biosimilars is of primary importance. Carrying out a test based on Bayesian techniques has been shown to support the probability of meeting the criteria. In addition, operating characteristics ( and patient risks) of the test can be obtained through simulations.
About the authors:
Jean-Francois Michiels is associate director, Statistics and Data Science, at PharmaLex, and has worked at PharmaLex for more than 10 years as a statistical consultant, mainly in CMC projects. He has more than 10 years of experience in several areas of pharmaceutical research and industry including bioassay and process development/validation, drug and vaccine discovery and manufacturing, with the usage various statistical tools such as design of experiments and advanced statistical models. He has a bioengineering degree from the Université Catholique de Louvain (Belgium-2003) and a PhD in animal cell culture (2004-2011-UCL-Belgium).
Terence Tem is a CMC statistician at UCB Belgium, where he provides statistical expertise to CMC drug development and manufacturing activities and supports regulatory submissions and investigations. He previously worked as Manager Statistics and Data Science at PharmaLex from April 2020 to April 2024 where he provided statistical consultancy in various areas of drug development and manufacturing. He holds a master’s degree in biostatistics.
[1] Descriptive and Inferential Statistics in Biomedical Sciences: An Overview, The Quintessence of Basic and Clinical Research and Scientific Publishing, 2023. Descriptive and Inferential Statistics in Biomedical Sciences: An Overview | SpringerLink
[2] Reflection paper on statistical methodology for the comparative assessment of quality drug development, EMA, 2021. https://www.ema.europa.eu/en/statistical-methodology-comparative-assessment-quality-attributes-drug-development-scientific-guideline
[3] Explorations in statistics: the log transformation, Adv Physiol Educ. 2018. Explorations in statistics: the log transformation (physiology.org)
[4] A Novel Bootstrapping Test for Analytical Biosimilarity, The AAPS Journal, Zahel, 2022. https://link.springer.com/article/10.1208/s12248-022-00749-3
[5] Using Bayesian statistical approaches to advance our ability to evaluate drug products, FDA. https://www.fda.gov/drugs/cder-small-business-industry-assistance-sbia/using-bayesian-statistical-approaches-advance-our-ability-evaluate-drug-products


